
TikTok content and audience intelligence
Anyone can point at what went viral. Sentiment 3.0 is the first to measure WHY it went viral.
Our AI-native data engine watches 10k top viral TikToks every week so you don’t have to.
Sentiment 3.0 brings together TikTok video analysis, comments and performance data to help media teams, agencies, researchers and brands investigate emerging topics and audience response.
Use the evidence to shape a brief, explore a content opportunity or ask a sharper research question. Query the analysis in natural language through Gemba’s MCP integration.
Three layers of intelligence
Content
Explore the subjects, themes and patterns appearing in the videos Gemba has analyzed.
Performance
Examine video and creator performance to understand the scale and distribution of attention in the available data.
Audience response
Investigate comment themes and inferred emotional and behavioral signals alongside the content that prompted them.
Start with a question
Sentiment 3.0 supports an exploratory research workflow. Questions to investigate include:
- Which topics are gaining attention in the analyzed data?
- Is a pattern appearing across several creators, or concentrated in a few videos?
- How do comment themes and audience-response signals differ across content?
- What evidence supports a trend that deserves a closer look?
Explore structured analytical results, comparisons and relevant video or creator examples, then follow up on the patterns that matter to your brief.
Bring the analysis into your AI workflow
MCP stands for Model Context Protocol. It gives compatible AI assistants a way to query Gemba’s analysis, so your team can ask questions in ordinary language and explore the results through a conversation.
Gemba’s integration provides read-only analytical access. The underlying evidence supports the answer; your team brings the interpretation, context and creative judgment.
Talk to us about the questions you need to answer, the AI tools you use and how the integration could fit your workflow.
Put the evidence to work
- Media and development teams: explore cultural themes and audience response to inform research and creative briefs.
- Agencies and brands: investigate content patterns and conversations relevant to a campaign or category.
- Researchers and strategists: compare patterns, test assumptions and identify questions for deeper investigation.
Keep the evidence in context
Findings reflect the available dataset and observation period. Emotional and behavioral signals are AI-inferred analytical indicators, not definitive readings of individual emotions or proof of what caused a result. Review them alongside the underlying content and the limitations of the sample.
The Weekly 10k

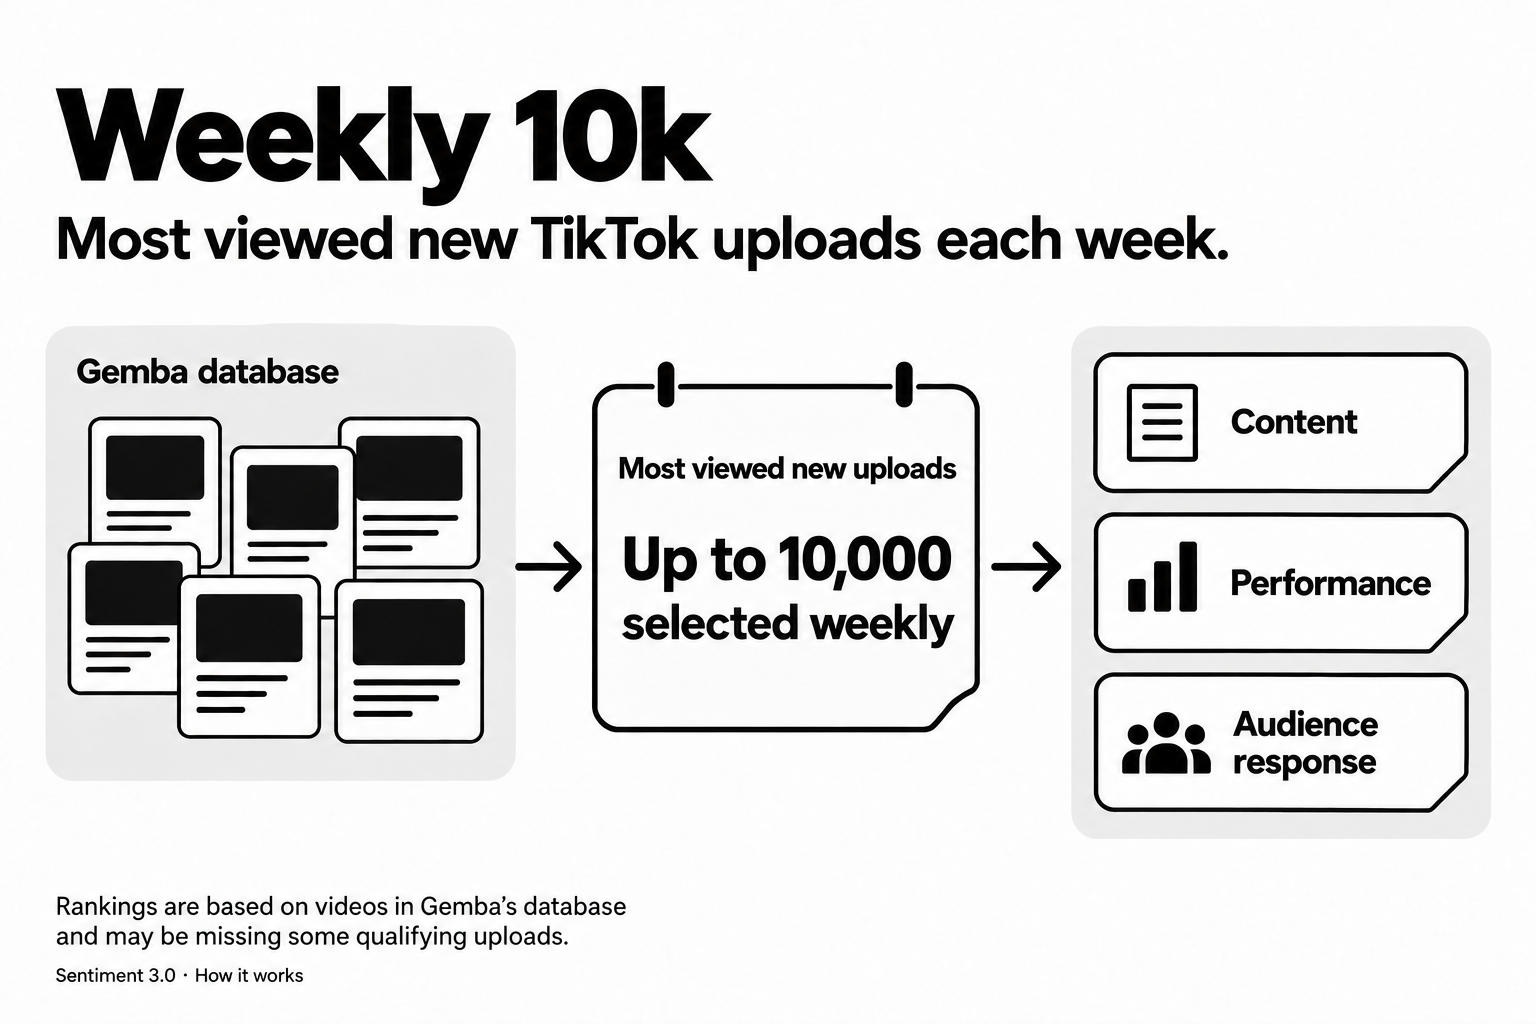
Most viewed new TikTok uploads each week
Each week, explore up to 10,000 of the most viewed new TikTok uploads in Gemba’s database. Connect what’s in the videos with performance data and available comments to spot patterns, sharpen a research brief and develop creative ideas. Rankings are based on videos in Gemba’s database and may be missing some qualifying uploads.
VAD

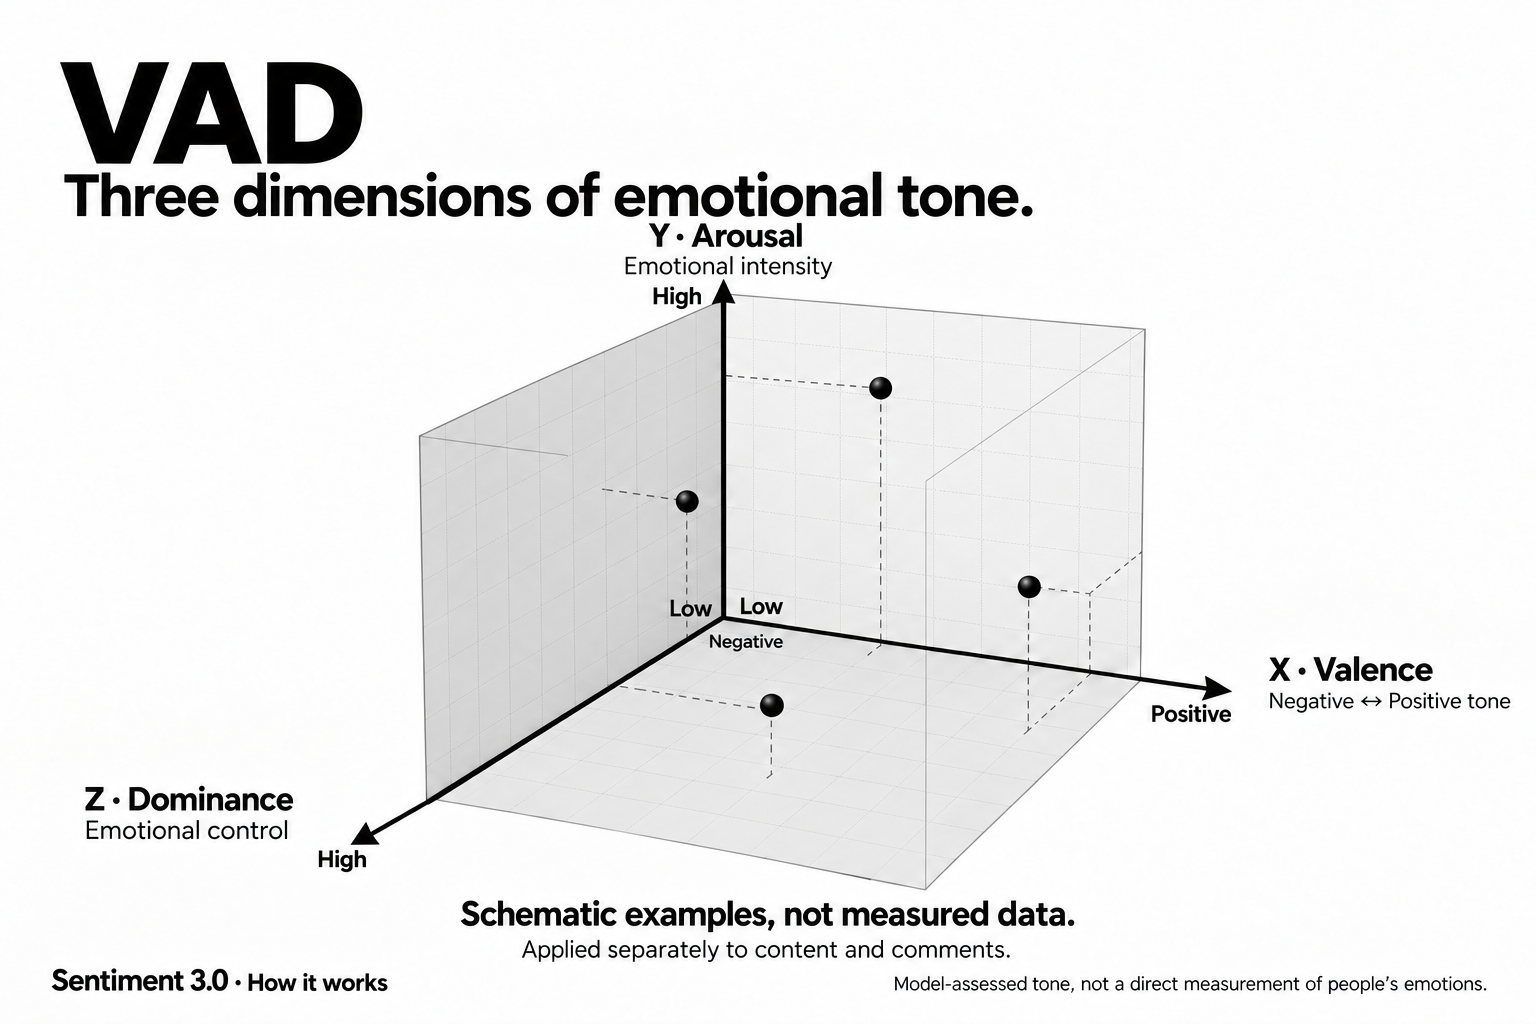
Three dimensions of emotional tone
- Valence: How positive or negative the emotional tone is.
- Arousal: Emotional intensity, from calm to highly activated.
- Dominance: Emotional control, from feeling overwhelmed to feeling in control.
Gemba assesses valence (positive or negative tone), arousal (emotional intensity) and dominance (emotional control). It applies these dimensions separately to video summaries and available comments. Comparing the two helps you investigate where the content’s modeled tone and the response expressed in comments align or diverge.
Explore why content resonates and spreads
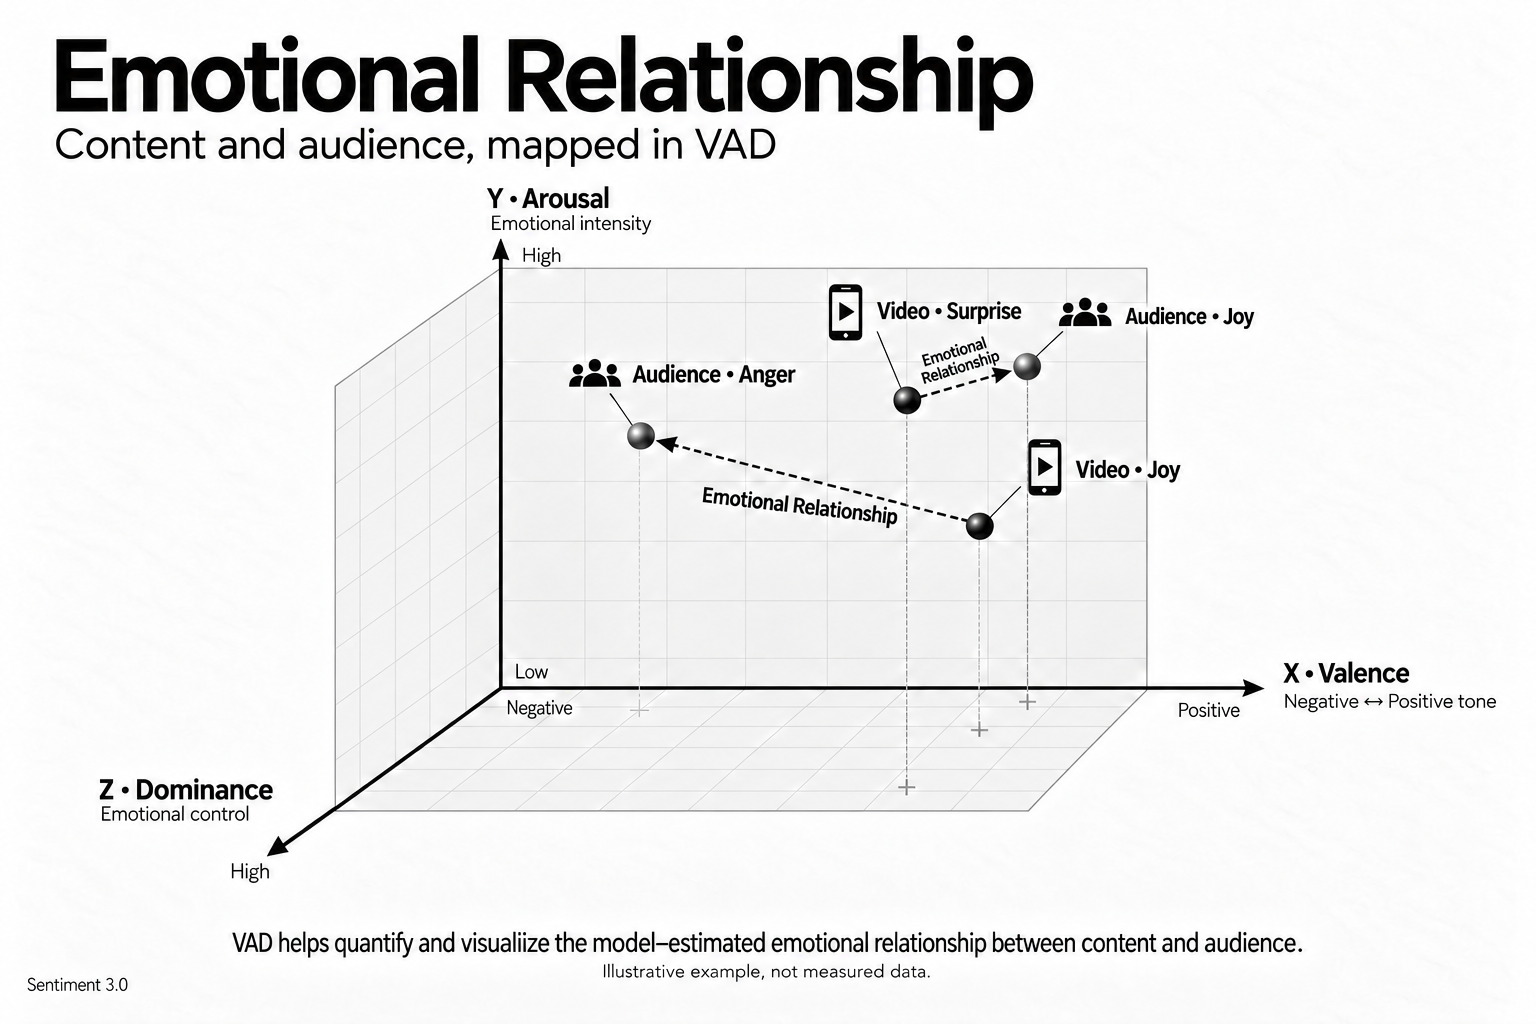
A video’s emotional tone and the response expressed in its comments are not always the same. Joy in a video can sit alongside anger in the comments; surprise can be met with joy. Mapping both in VAD space helps you see where tone and response align, diverge or differ in intensity, and decide which relationships deserve a closer look.
Sentiment 3.0 combines these comparisons with content themes, motivational coding and performance data, including views, likes, comments and shares, across Gemba’s weekly video selections. Bringing these signals together helps you compare highly viewed or widely shared videos, spot recurring content-and-response patterns and build evidence-based hypotheses about why they spread.
These relationships are model-estimated from analyzed video summaries and available comments. They do not represent every viewer’s feelings or prove what caused a video to go viral.
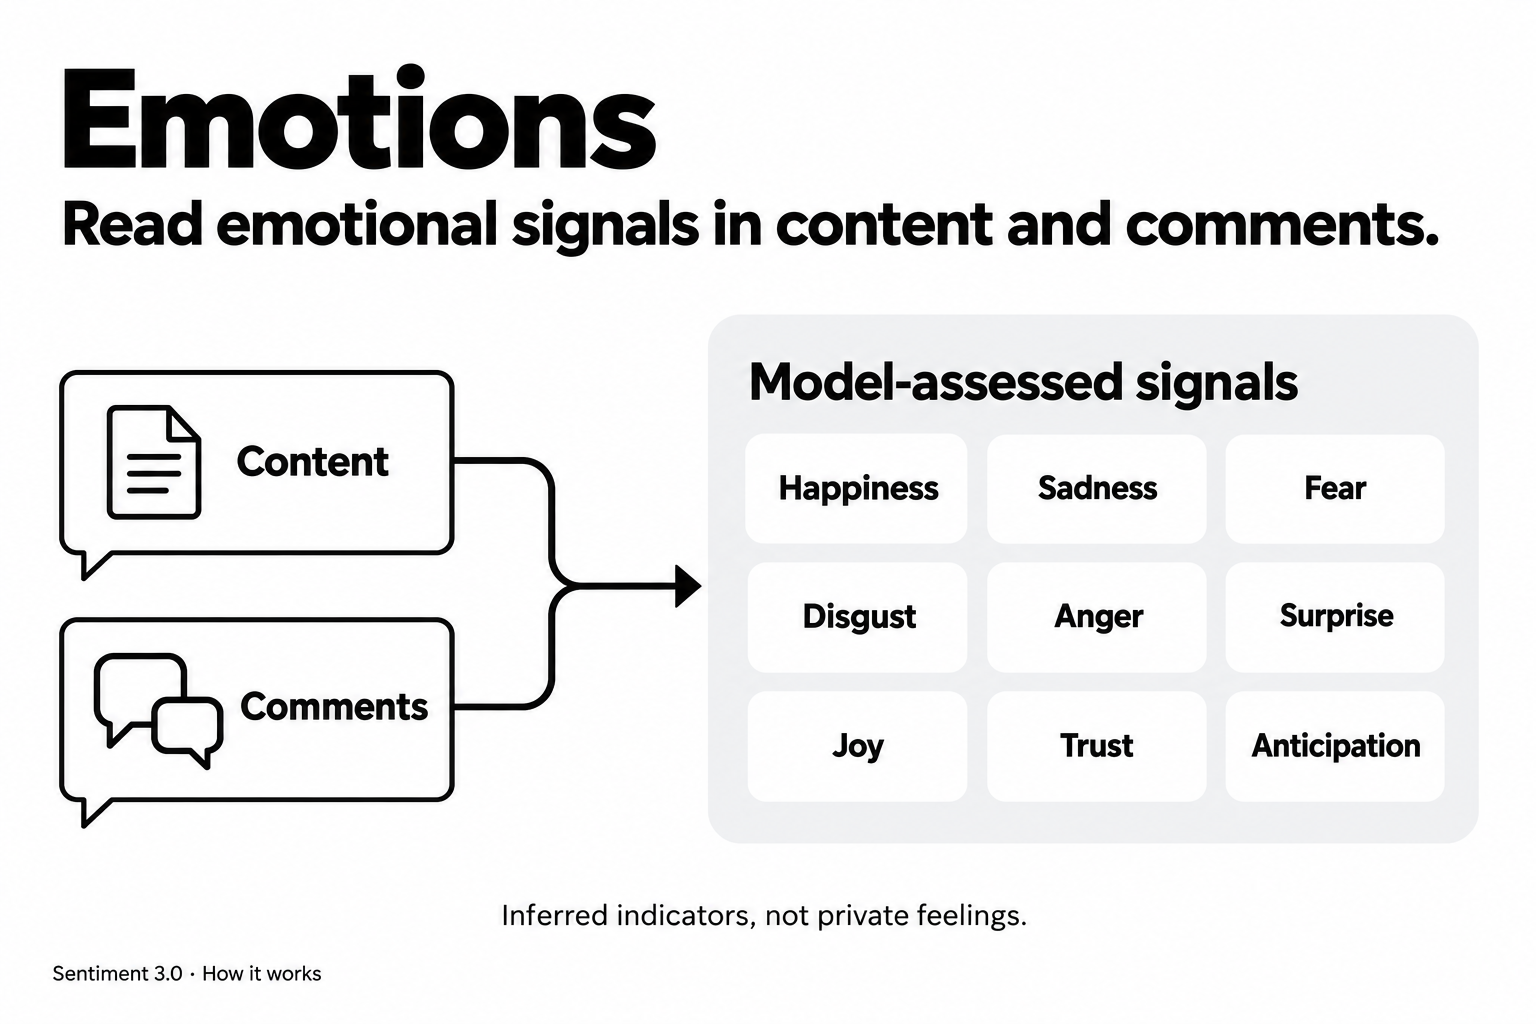
Emotions
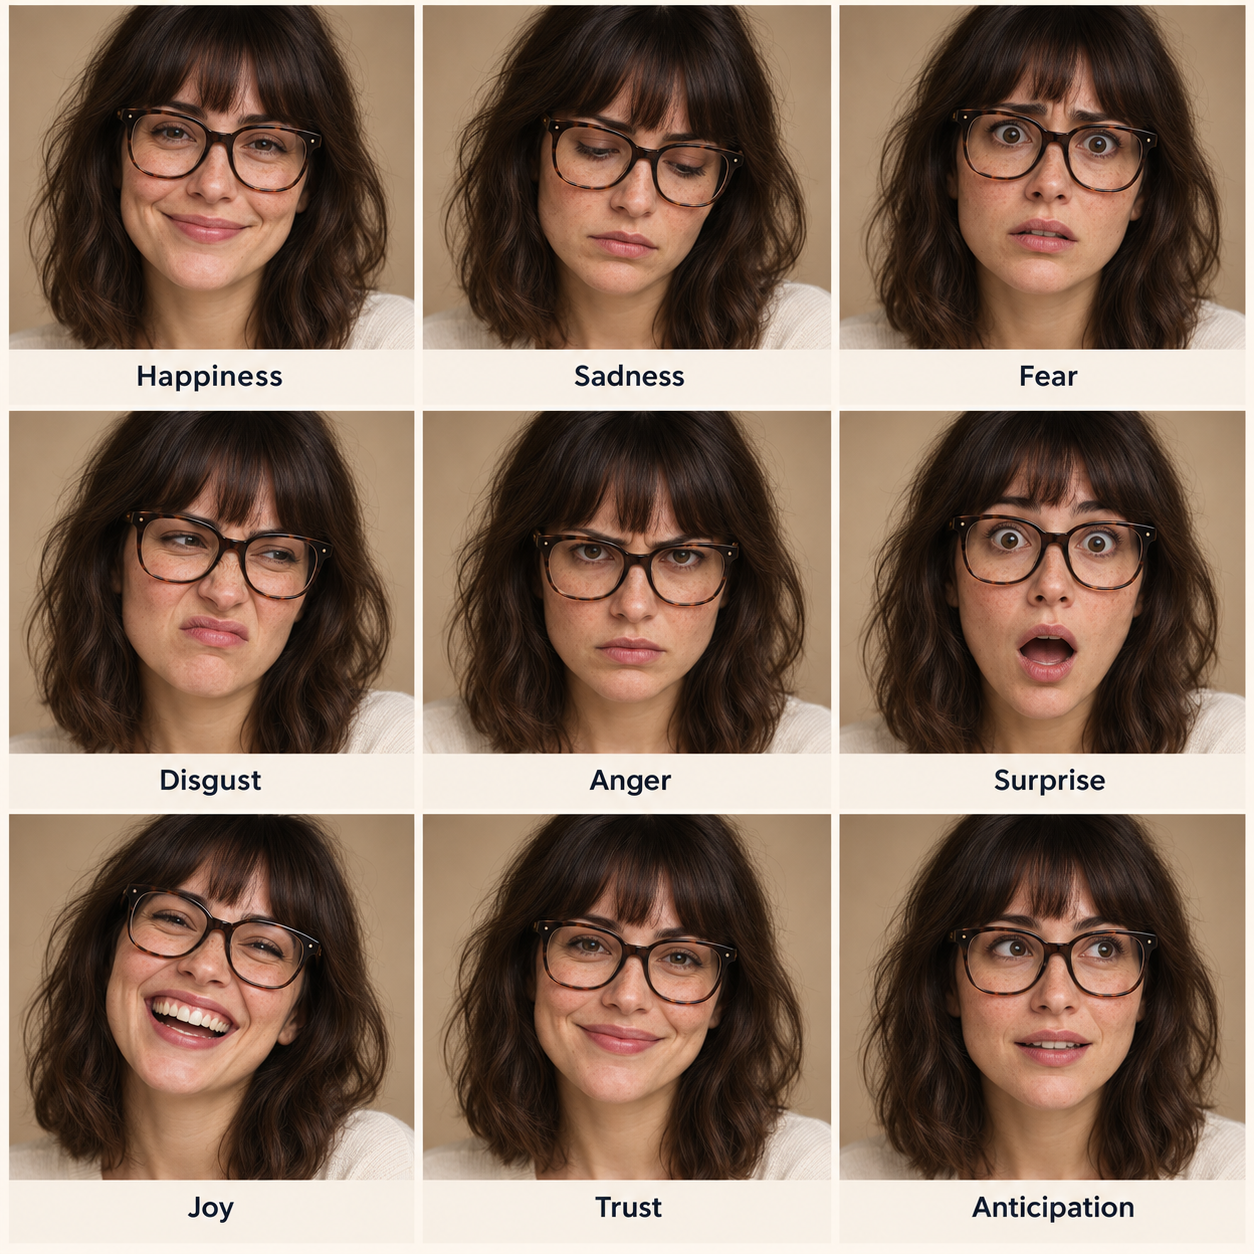
Nine categories, two perspectives
Explore the emotional detail behind a conversation. Gemba assesses nine emotion categories in video summaries and available comments, including joy, anger, surprise and trust. Compare content and comment patterns to develop more specific questions about audience response.
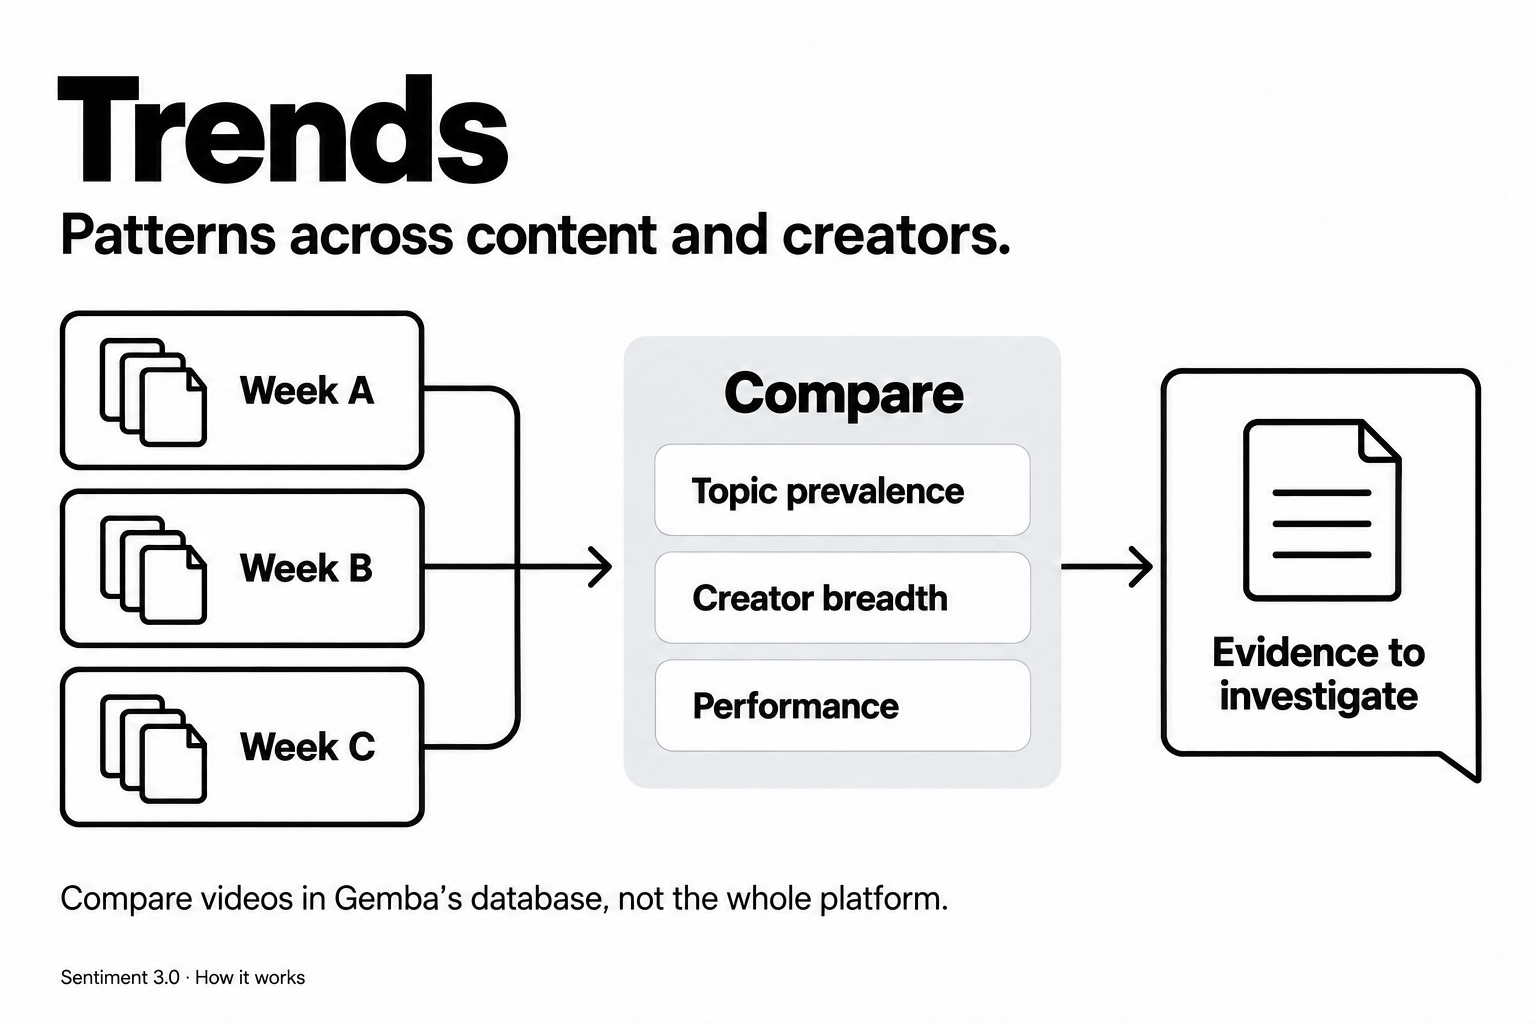
Trends
From individual videos to recurring patterns
See the patterns connecting individual videos. Gemba organizes content into structured themes and trend labels, alongside narrative tone, recurring keywords and audience-response signals. Compare these patterns across creators and weekly selections to investigate what is gaining attention within the analyzed data.
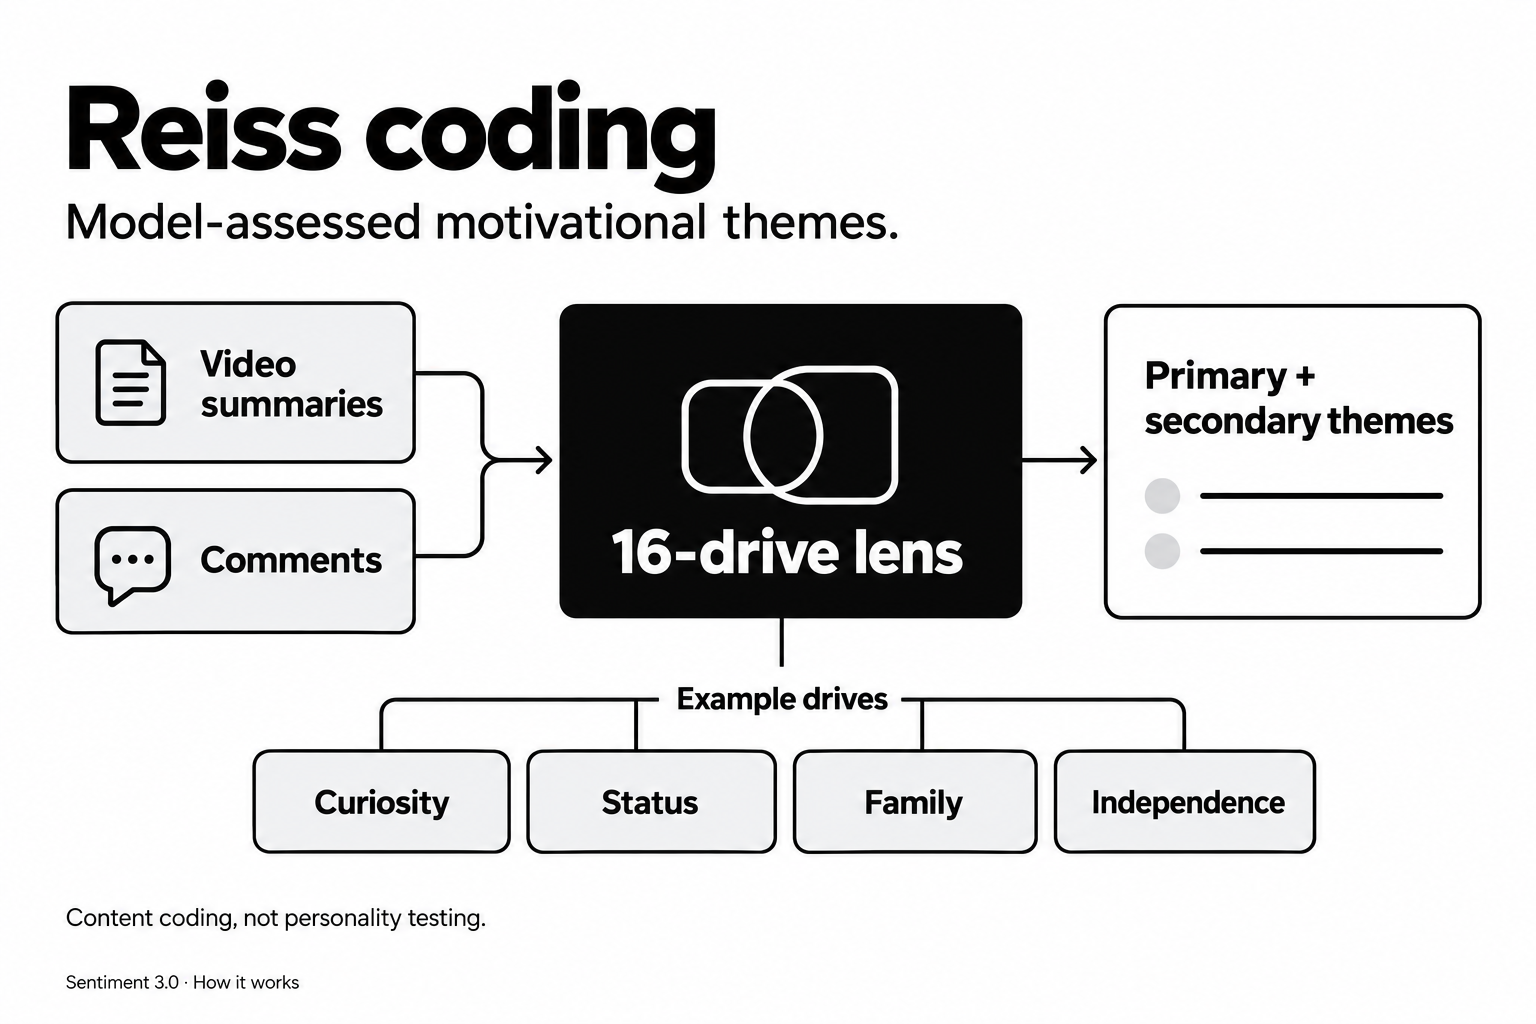
Reiss Coding
The motivational themes in content
Explore the motivations a piece of content appeals to. Gemba’s Reiss-informed coding assesses content through 16 motivational themes, such as curiosity, status, family and independence, and highlights the most prominent themes. Use these signals to sharpen a creative brief and compare content approaches; they describe content, not a viewer’s personality.
Behavior
Observed engagement, interpreted in context
Put audience-response signals beside observed engagement. Gemba combines views, likes, comments and shares with content, emotion and motivational features to classify behavioral patterns. Explore how these patterns differ across videos and weekly selections, while keeping observed activity separate from model-based interpretation.
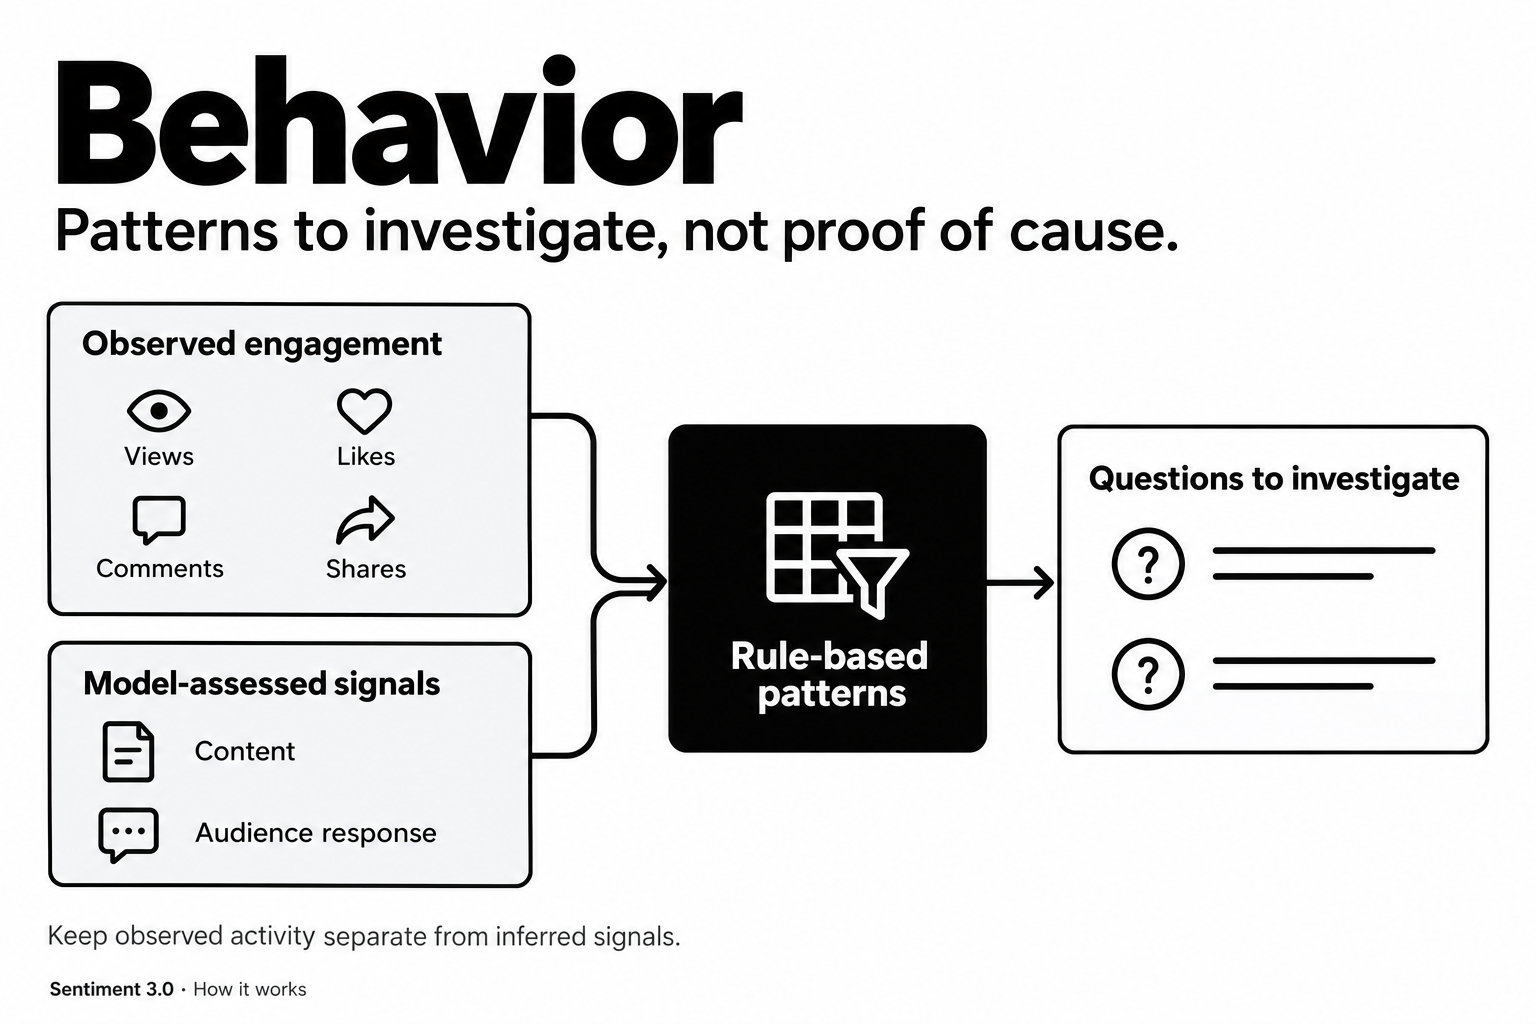
Keep the evidence in context. Rankings are based on videos in Gemba’s database and may be missing some qualifying uploads. Findings reflect Gemba’s selected dataset, observation period and available comments, not a representative sample of all TikTok users or viewers. Emotional, motivational and behavioral classifications are model-based indicators, not definitive readings of individuals. Associations do not establish causation. The illustrations explain the method; they do not show measured results.
What would you like to understand?
Bring a research question, a content brief or a workflow you want to improve. In a 30-minute introductory call, we’ll discuss where Sentiment 3.0 could be useful and what you would need to evaluate it.